
Description
ARM2 — ARM2 Task 1: Population Health Data Paper


Your submission must represent your original work and understanding of the course material. Most performance assessment submissions are automatically scanned through the WGU similarity checker. Students are strongly encouraged to wait for the similarity report to generate after uploading their work and then review it to ensure Academic Authenticity guidelines are met before submitting the file for evaluation. See Understanding Similarity Reports for more information.
You must use the rubric to direct the creation of your submission because it provides detailed criteria that will be used to evaluate your work. Each requirement below may be evaluated by more than one rubric aspect. The rubric aspect titles may contain hyperlinks to relevant portions of the course.
Use the attached “Population Health Data Paper Template” to complete the following components:
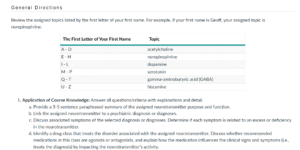
A. Provide a 3-5 sentence introduction describing the selected county, including the county and state and the overall health outcome ranking.
Note: The overall health outcome ranking is found on the County Health Rankings & Roadmaps website in the County Snapshot section. Review the bubble graph in the CountySnapshotsection to determine if your selected county is ranked at, below, or above the state average.
B. Complete the “Sociodemographic Profile” section by doing the following:
1. Provide a screenshot of the state map with your chosen county highlighted. Include the screenshot as a labeled figure (Figure 1).
Note: Include the source of your map.
2. Complete Table 1, “Sociodemographic Profiles for [County, State] and the United States,” by providing data for eachof the listed population characteristics for the selected county and using the data source(s) of your choice.
Note: Include the source(s) of your data.
3. Discuss the data provided in part B2, comparing the county data to the United States data, and summarize your findings.
C. Complete the “County Health Outcomes” section by doing the following, using the “County Health Rankings” web link for charts and data:
1. Select seven health trends for the chosen county, and provide one trend graph for eachhealth trend, resulting in a total of seven health trend graphs. Include these health trend graphs as labeled figures (Figures 2–8).
Note:Include the source of your graph. You may copy and paste an existing graph from anywhere on the “County Health Rankings & Roadmaps” website (such as health infrastructure, social and economic factors, and physical environment) if available. If a trend graph is not provided for a selected health trend, you will need to create a trend graph for that health trend using an application of your choice (e.g., Excel). Created trend graphs should include your selected county and state data along with the United States data and show a trend of data over time.
2. Complete the “County Health Trends and Rankings Discussion” subsection by discussingeachof the seven health trends selected in part C1, including what the health outcome is and whether each trend is improving, worsening, or remaining stable.
D. Complete the “Health Factors” section by doing the following, using the “County Health Rankings & Roadmaps” web link for data:
1. Complete Table 2 by providing data for each of the listed factors influencing health for the selected county, the state, and the United States.
Note: Include the source of your data.
2. Discuss the purpose of comparing county health ranking data toboth state and United States data.
3. Discuss successes and challenges for the selected county when comparing the data to the state and United States.
Note: Review selected county data using Table 2.
E. Complete the “Analysis and Proposal” section by doing the following:
1. Complete the “Significant Findings” subsection by summarizingoneof the seven health trends selected from part C1 that has the potential to be improved by the creation of a service or program.
2. Complete the “Service or Program” subsection by creating a new service or program that may be introduced by the advanced professional nurse in the county to address the identified health trend from part E1.
3. Complete the “Action Plan” subsection by describing the initial steps needed by the advanced professional nurse for planning and implementing the service or program created in part E2.
4. Complete the “Raising Public Awareness and Promoting Public Engagement” subsection by discussing how the advanced professional nurse could use twoforms of technology to raise public awareness of and promote public engagement in the service or program from part E2.
5. Complete the “Evaluating the Service or Program” subsection by describing how you would evaluate the effectiveness of your program. Include the data collection tool that could be used to visually represent your collected data.
Note: Refer to page 61 in the course of study to review information on data visualization.
F. Acknowledge sources, using in-text citations and references, for content that is quoted, paraphrased, or summarized.
G. Demonstrate professional communication in the content and presentation of your submission.
ARM2 — ARM2 Task 1: Population Health Data Paper
Solution
Population Health Data Paper
Student Name
Leavitt School of Health, Western Governors University
D029: Informatics for Transforming Nursing Care
Instructor Name: Exam Loft
Date:9/12/2025
Population Health Data Paper
Introduction
Hillsborough County, situated in southern New Hampshire, consistently ranks among the top counties in statewide health evaluations. According to the 2025 County Health Rankings & Roadmaps, its overall population health and wellbeing scores align with the New Hampshire state average but surpass the national average (County Health Rankings, 2025). The county performs particularly well in areas such as quality of life, access to exercise opportunities, and low air pollution levels. Collectively, these indicators position Hillsborough County’s overall health outcomes very close to the state’s average while remaining stronger than most counties across the United States..
Sociodemographic Profile
Figure 1
Purchase the full solution for $20


Customer Reviews
There are no reviews yet.